Impact of the COVID-19 Lockdown on the Indian Village Economy
Survey on Migrants’ Health, Household Economy, Access to State Services, and Beliefs During COVID-19
Luisa Cefala∗ Supraja Parthasarathy† Vasanthi S Pillai† Supreet Kaur∗ Heather Schofield§
Last Update: Dec 07, 2020
Executive Summary
We present a summary of the salient ways in which informal workers―who are disproportionately local migrants―have been affected by the COVID-19 pandemic and the associated lockdowns. This report is based on five rounds of household surveys conducted over the period of June - October. The sample consists of male migrant daily-wage laborers primarily employed in construction recruited in Chennai but mostly from villages or towns in Tamil Nadu, and their wives.[1] Participants attended a minimum of one round and a maximum of five rounds.
First, migrants headed home towards family, villages, and native places from Chennai when the lockdown began, but then began heading back to Chennai by July. This trend of returning to the city continued to pick up speed in August. Almost 41% of our sample reported being in their native district in the month of May-June, which fell to 27% in the month of October. In the final round, conducted in October, we find 73% of our sample residing in Chennai.
Second, employment was concerningly low during the months of May and June at almost 45%, however the month of October witnessed a transition to almost 87%. There was a significant change in employment status between rounds and the overwhelming majority of this was towards seeking and finding work. Moving back to Chennai, marked a clear improvement in chances of employment and, likely, drove much of this trend. Among women, roughly 30% of the population find work after the lockdown.
Third, most migrants have growing awareness of various COVID-19 precautions, though some report important barriers to taking necessary precautions. Guidelines such as wearing masks and washing hands are broadly considered important. However, there remains a level of fear associated with the pandemic and it's uncertainty. About 45% of male participants report being very scared or terrified about this situation. There is also drop in mental health status for both men (by 4 points, SD 3.6) and women (by 2.9 points, SD 3.4) when comparing Cantril's ladder positions reported retrospectively by respondents to present well being status.
Finally, stigma around travelling migrant population is seen to exist. When respondents were asked how they think migrants who travel back to natives from work places would be treated by people around them, on an average almost 63% answered that these migrants would be assumed to be ill.
1 Data and Sample
This data was collected to study the impact on the daily lives of migrant workers in Tamil Nadu due to the Coronavirus pandemic, the lockdown, and other state policy responses to the pandemic. The participants are Indian rural-urban migrant workers employed casually in construction in Chennai who were a part of a previous study, and wives of the migrant workers. The data was collected through phone surveys. This report is based on surveys from 5 rounds of the primary module studying male laborers and 5 rounds of secondary module studying wives of the migrant labourers. Each round is defined by calendar months, starting in May and concluding in October.[2][3] Information on the timing of these surveys is provided in Table 3 in the appendix. Each participant attends a minimum of one survey to a maximum of five surveys. While there was some attrition in the sample that caused the smaller sample in subsequent rounds, the same workers continue to be surveyed across time.
2 Demographics
Participants are primarily from districts of the state of Tamil Nadu, though a small fraction of participants are from neighboring states. The median age of a participant is 42 with about 92% of our sample being married. The median age of female participants is 36 years. Each household on an average has about two children and 4 members. About 55% of our sample live in a house with Asbestos/tile/metal roof, 32% under concrete roof. The rest of the sample indicate living in huts, housing boards, and tarpaulin roofed houses.
In addition, since there has been a considerable amount of attrition from one round to the other, in order to understand temporal variation in baseline factors, the table 1 below is presented. The table represents baseline measures in each round to make shifts in sample composition salient.
Although there has been attrition, demographic factors remain more or less the same, across rounds. Average age, income pre-covid[4] and remittances sent back home pre-covid[5] remain fairly similar.
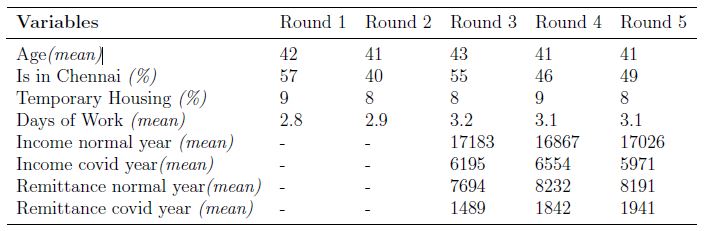
Table 1: Baseline Characteristics Across Rounds
Notes: i) All income and remittances are in Indian Rupees. ii) Temporary housing includes - on the platform/uncovered on the streets, houses with tarpaulin roof and huts.
3 Movement
There has been evident movement of migrant workers when data across months is observed. The percentage of participants in Chennai transitioned from 59% in May-June to 73% in October. Further, overall on an average, 21% of the population has mentioned that they had moved recently. This movement is seen to be majorly towards Chennai. Among those who said they had moved, 64% reported to have moved to Chennai.
Figure 1 represents the movement across months which shows a clear increase in fraction of respondents in Chennai with time.
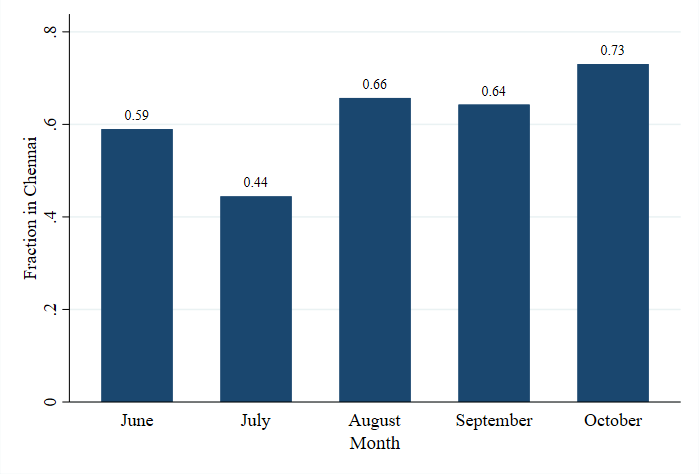
Figure 1: Fraction of people in Chennai
Given this movement towards Chennai, an analysis of the percentage of respondents in an urban[6] locations also showed a spike from 56% in the month of May-June to 63% in the month of October. This is complimentary to the increase in the fraction of people in Chennai.
At a time when modes of transport were limited, it was also important to understand if inter-state migrants received any form of assistance. Hence, when the respondents were asked if they had received any form of assistance from governmental or non-governmental organizations, 13% mentioned to have received governmental assistance in October.
Figure 1: Fraction of people in Chennai
4 Employment
There has been an upward trend in employment levels. While in May-June the level of employment on an average was 45%, this moved up to almost 87% by the month of October. The percentage of respondents who never tried to find work reduced from 24% in the month of May-June to 4% in the month of October. For 32% of the population surveyed in October, labor stands[7] is seen to be the source of finding employment. When looking at how the respondents travelled to the labor stands in the month of October after the lockdown, we find the prominent mode of transport to be motorbikes with 54% (n=28) of the population using the same, followed by government bus and cycle, each used by 14%.
4.1 Trends in Employment
In addition to the above, the number of days worked in response to lockdown related announcements was also observed. Two major announcements that signal relaxation of lockdown were picked. Tamil Nadu was in lockdown since 23rd March 2020. Once the lockdown was in place there were gradual relaxation announcements done mostly at the end of every month for the next month. There were multiple phases of relaxation announced on different dates. Therefore, major relaxation announcement dates that consisted of highest number of relaxations were decided to be included, and they are: 29th June 2020 and 30th August 2020. These dates also coincided with the survey period to ensure sufficient data points. Figure 2) illustrates days worked in the past week for respondents from Chennai and from other districts within Tamil Nadu, from June to October.
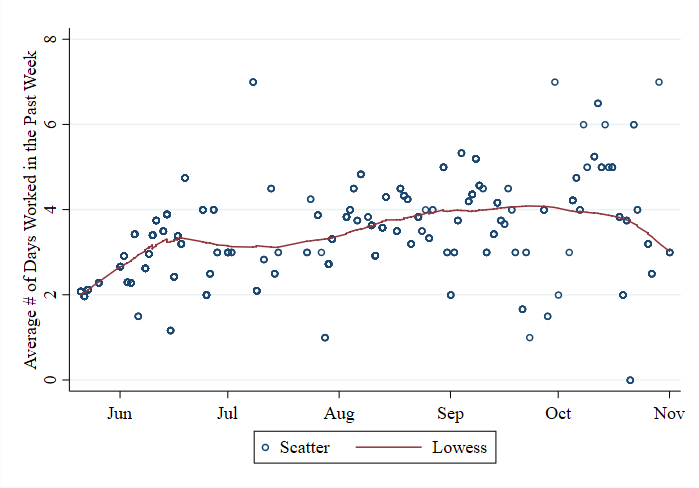
Figure 2: Self-reported number of days of work in the week previous to the interview
As mentioned previously, this graph displays number of days worked[8] through the period of lockdown. The line represents the fit for average number of days worked in the past week. An upward trend is observed overall and one can also observe the bump in the from the month of August and stays around the same number 4 until October.
4.2 Women and Employment
Women and Work: We also spoke to women about their employment status, to understand how it has changed since the pandemic and also to identify the dynamics of household work. Close to 66% of our sample mention that they were engaged in some kind of paid work before the lockdown. When asked about post lockdown work status, in the month of June 28% women mention to have found work, while in the month of October 38% women have been able to find work. Among those who said that they found work after the lockdown, about 48% are engaged in construction work and 30% in agricultural work. Besides conventional means of employment, self help groups have been playing a important in the lives of people. 29% of our sample are part of Self help groups. Among them across all rounds, 68% report activities of Self help groups to be paused. With the pandemic and the lockdown, there have been changes in the amount of household work undertaken by women and men. 24% women report that there has been more work than usual. Moreover, 68% of those who said they have been doing all the household work before the lockdown, report that there has been no change in the amount of work they do after the lockdown. However, 31% women, across all rounds report that their husbands have been more involved in household chores. When it comes to carework, 74% women report to be doing all carework within their households.[9]
5 Food Security
The Tamil Nadu state government offered cash transfers of Rs. 1,000, eligible to be received by its poor citizens|those eligible to receive rice and ration commodities at the shop, from March 2020 to June 2020. This cash is distributed by offering tokens to receive the transfer at the ration shop. There were implementation gaps in the delivery of this cash transfer. In the months of May and June among the 95% of respondents who have a ration card, about 27% mentioned not receiving the cash and 24% of those who did not receive mentioned that they were unaware of their eligibility to receive the cash. With respect to commodities distributed via the ration shop, out of those who had ration cards, 92 % mentioned they received everything in the month of October slightly higher than 84% in the month of May-June. In October the percentage of respondents who mentioned that they received fewer commodities or lesser quantities of commodities fell to zero from 11% in May-June. On the other hand, the sample that did not receive anything at all moved up from 6% in May-June to 14% in October. In this particularly difficult time, across all five months about 43% mention that they do not have sufficient food for the net two weeks and about 7% say "maybe" when asked about sufficiency of food. While the number of respondents who said "yes" for sufficiency reached the highest in September, October saw a dip in that number. In October, there was an increase in the percentage of those who said "no" and "maybe". About 40% of the male participants across all rounds mention that reducing family's intake is their way of managing shortage in food. Moreover close to 32% of women, across all rounds mention that they have reduced their personal intake.
[10]
6 Health
6.1 Leaving the house
The immediate consequence of any lockdown related announcement is observed in the decisions of individuals to go out of their homes. Therefore, it is important to look at frequency of going out changed through the different periods of lockdown. Figure 3 represents the variation in the average monthly fraction of respondents going out. Each bar represents the monthly average fraction of respondents who answer to have gone out at least 3-4 times a week.
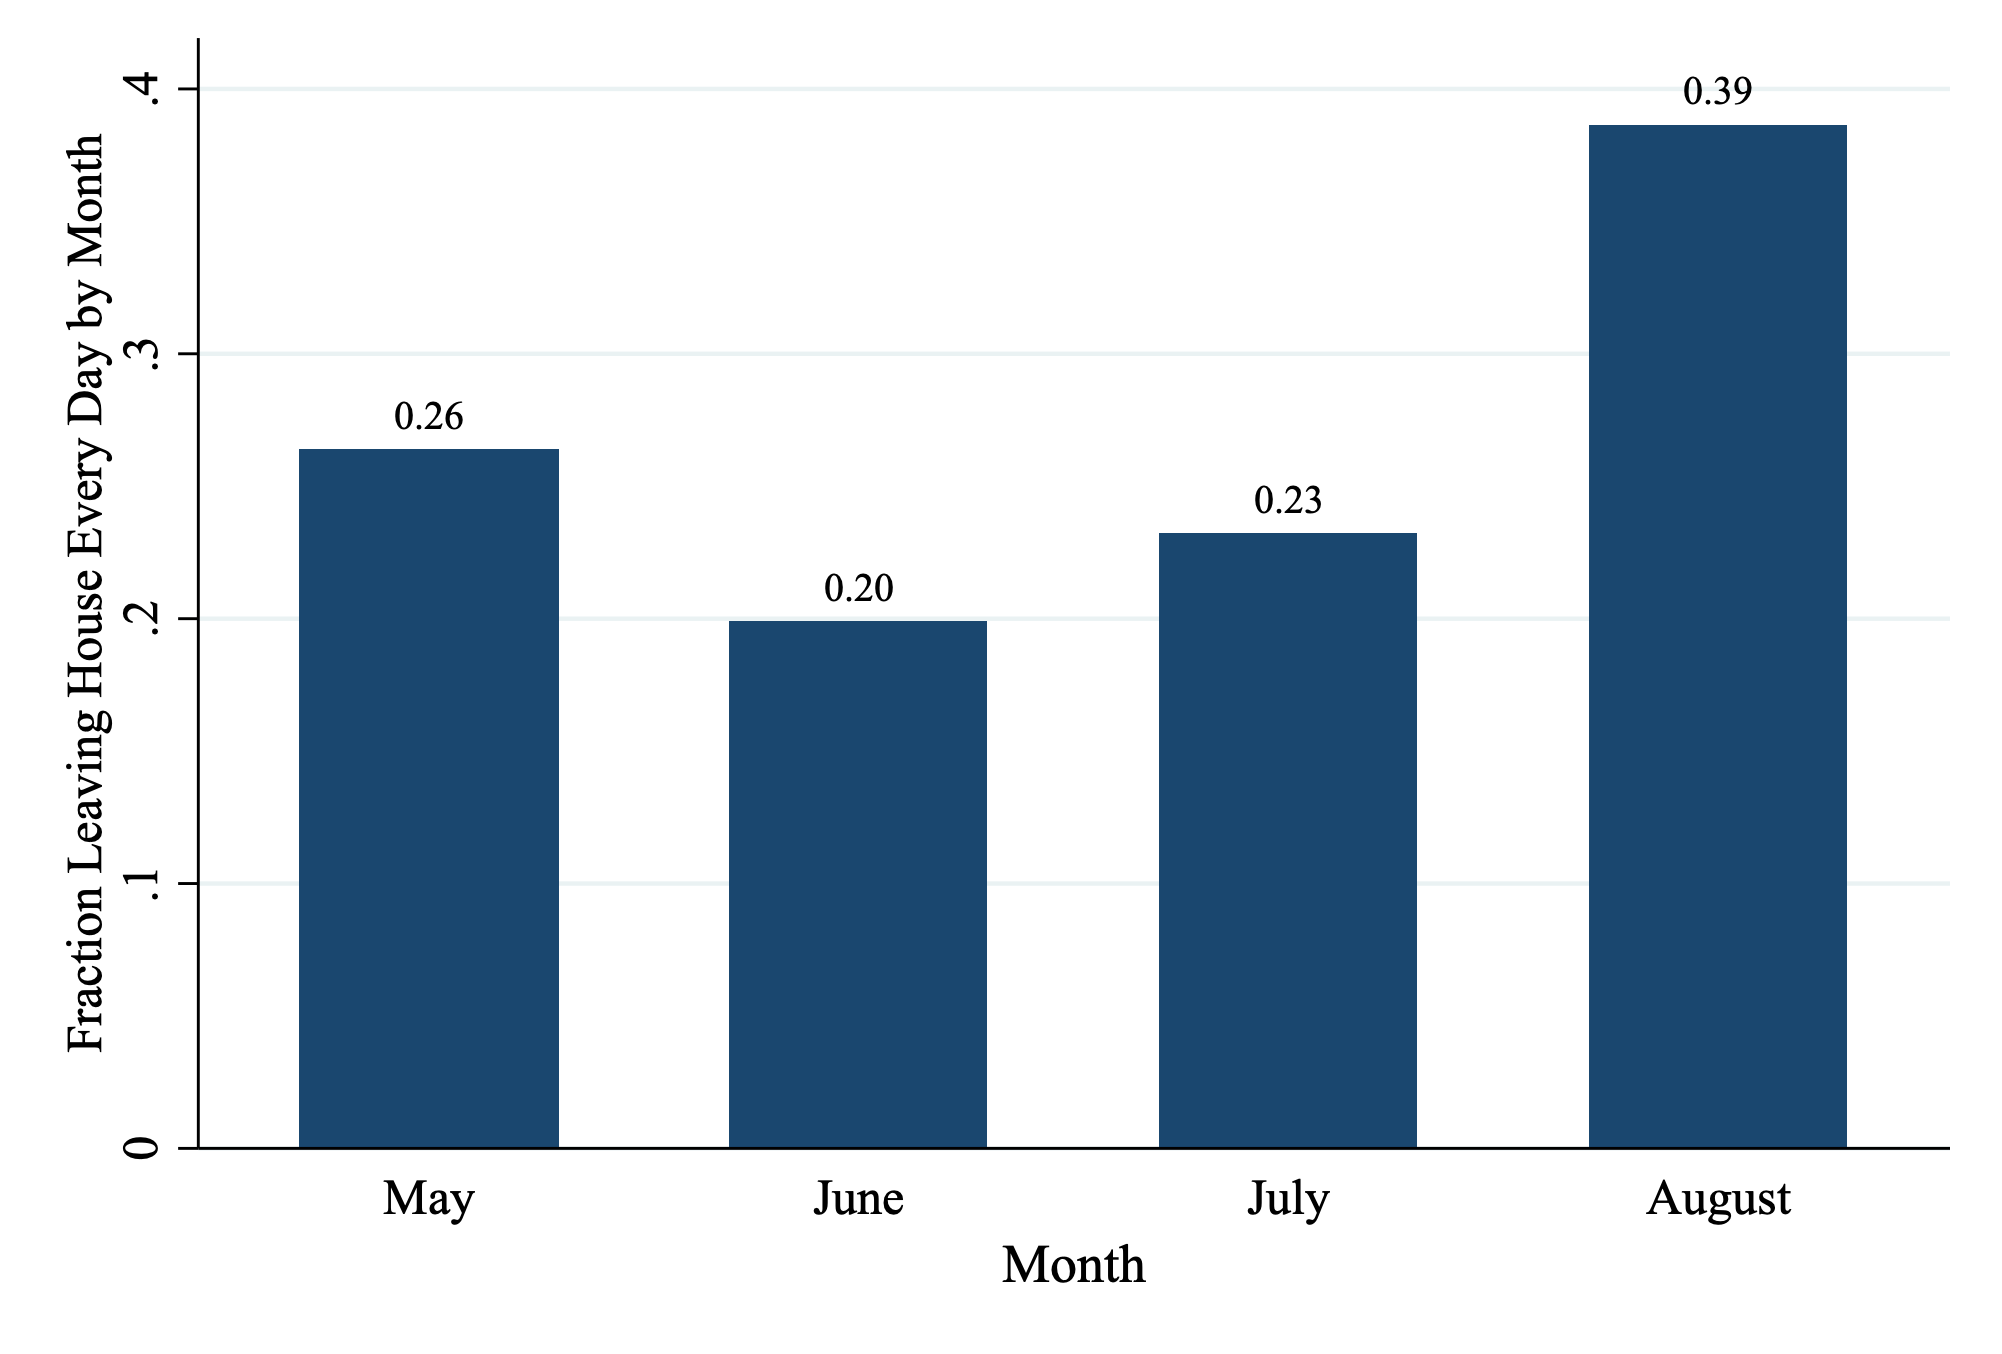
Figure 3: Left House
There is a clear upward movement from the month of July, in fraction of people going out, which coincide with the lockdown relaxations that took place since the month of July. In addition, looking at the factors that have an implication on the decision made by respondents to go out it is observed that living in urban areas and living in Chennai influence the above decision to an extent.
6.2 Mask Usage
From a list of advise received between May and August, 44% of the participants mentioned that they were advised by people around them to wear a mask and 55% mentioned that they were advised by a government representative to wear a mask. When assessing usage of masks, it is also important to understand availability and accessibility. Participants report an average cost of Rs. 29 for the mask. Most places where the participants buy masks are local stores (70%) and pharmacies (44%), with about 7% participants also mentioning using homemade masks. We also asked participants their perceptions of safety associated with wearing a mask. On a scale of 1 to 5, where 1 stands for completely unsafe and 5 stands for completely safe, the average safety level while not wearing a mask is 1.9 and while wearing mask is 4.1. When a participant looks at someone else wearing a mask while they are not, participants indicate a safety level of 2.6. This figure represents a gap in knowledge about the purpose and efficacy of mask-wearing. The graph 4 below indicates a overall change in safety perceptions across rounds.
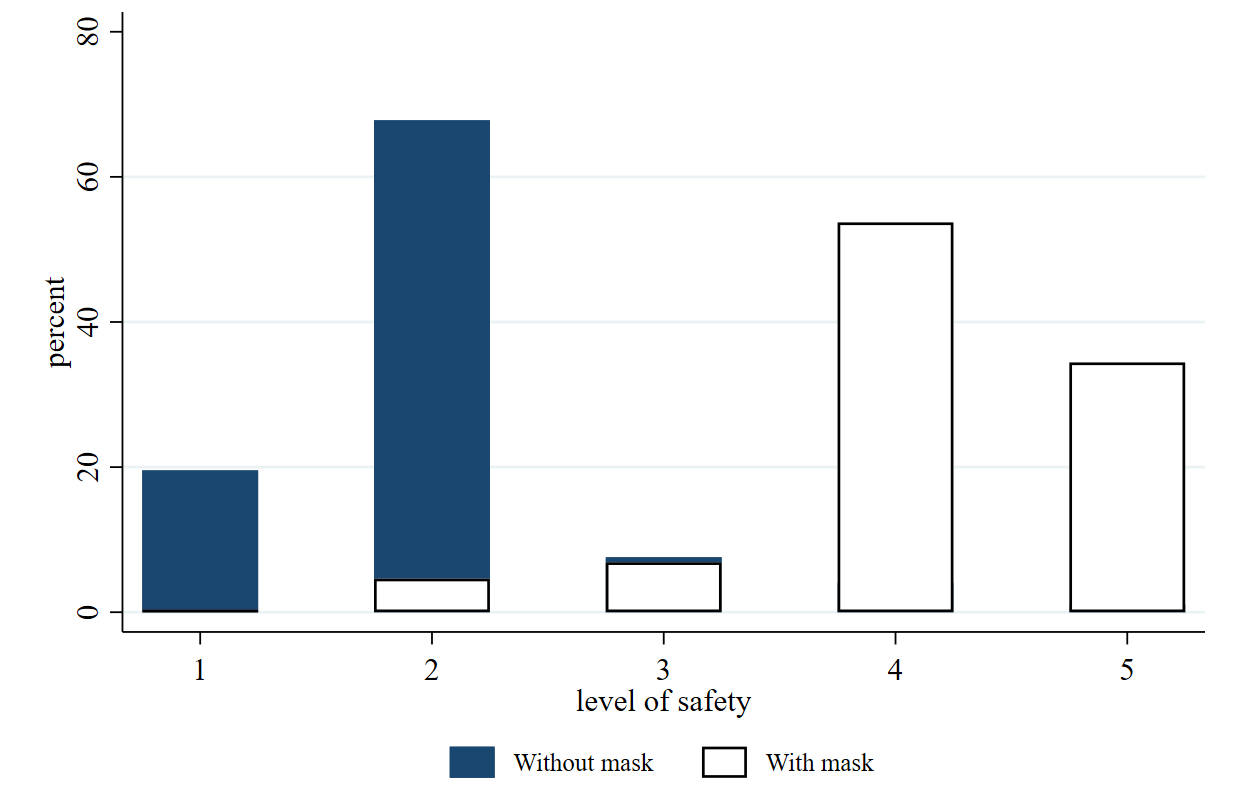
Figure 4: Safety Perceptions
Participants were also asked, on average how many people they would see wearing a mask in queue of 10 people at a ration shop. Figure 5 is a graph that plots the number of individuals wearing face covers, throughout the survey period from June to October. The two lines in the graph indicates the fit line for number of people wearing covers in Chennai and in other districts. Any element in blue represents data points for Chennai and elements in red represents data points for other districts.
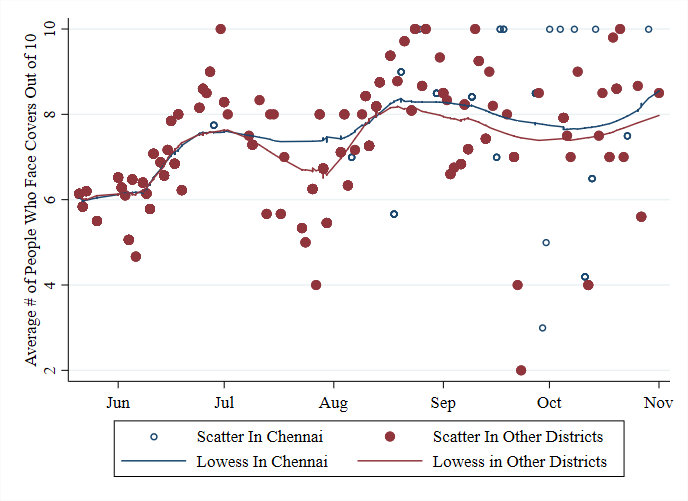
Figure 5: Face Cover Usage
The above figure point to overall rise in the numbers from the end of August which is exactly after the second relaxation date. Further, as much as there is high awareness about wearing masks amongst our sample, 33% of our sample indicate that they do not like the way it feels, but close to 62% of them say they do not have any problem wearing masks.
6.3 Washing Hands
Washing hands frequently has been emphasised through different mediums like newspapers, radio shows and instructions from local government representatives. When asked how important it is to wash hands, on a scale of 1 (not at all important) - 5 (very important), 44% state it is very important and 52% state it is important across all rounds. Close to 2% of our participants indicate that it is neither important nor unimportant. On an average participants tend to wash hands 5 times a day. On that note, 96% of them mention that they have access to water for handwashing.
6.4 Mental Health
With uncertainty in employment, health status and quality of life, the pandemic has taken a toll on the mental health of individuals. We measure mental health of individuals using three indicators, namely: i) fear associated with the pandemic, ii) Cantril's Ladder[11], and iii) PHQ-4 Score.[12]
Fear Level: When participants were asked on how scared they feel about the situation, across all rounds, on an average 45% men and 27% women report to be either very scared or terrified. 18% men and 28% women report to be a little scared. While for the male population this fear level has fluctuations and does not continuously increase or decrease over months, among women there is a downward trend in fear level from the month of September.
Cantril's Ladder: An analysis of the ladder positions is presented in Table 2 with the difference between post lockdown and pre lockdown positions indicated in each round of survey. A negative difference indicates that the well-being positions before the pandemic were better than the position mentioned after the pandemic. The table depicts a dip in the mental health position among both men and women. Increased pressure to find work and the necessity to compensate for the fall in basic sustenance throughout the lockdown period are a few contributing factors.
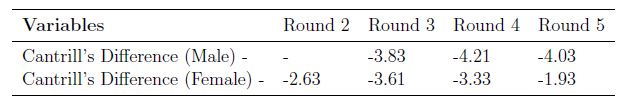
Table 2: Mental Health- Cantrill's
PHQ-4: The PHQ-4 is a standardised test that measures four different aspects, namely i) anxiousness/nervousness, ii) constant worrying, iii) lack of interest/pleasure in doing things, and iv) feeling low, hopeless. A higher score represent a worse off mental health state. On an average PHQ4 score for each question, across rounds among the men is 2.38 out of 4 and 2.18 out of 4 for women. The scores do not vary too much across rounds (oscillates around a score of 2). However, there is variation in individual elements of the PHQ-4 questionnaire, people score higher when asked about anxiousness/nervousness in comparison to the other aspects.
7 Information and Stigma
7.1 Useful information
When the male respondents were asked if they think they found a particular information more useful during the pandemic, overall, almost 57% of the the sample believe that daily health based status update regarding the pandemic was useful followed by 44% participants indicating speeches given by government representatives to be important.
7.2 Channels of Information
In order to understand the channels of different information received, male and female participants were asked to rank three different channels of information based on their importance and likelihood of implementation. In the male sample, with respect to how important they consider a particular source of information to be, 44% respondents gave first rank to speeches given by government representatives followed by almost 41% of respondents giving second rank to preventive measures advised by local governments. Similarly, in the female sample, 42% respondents gave first rank to speeches given by government representatives followed by 39% of respondents giving second rank to preventive measures advised by local governments.
Further, in the male sample, with respect to which source of information the respondents are most likely to implement, the ranks have the same order as above, with almost 53% choosing speeches by government representatives and almost 51% choosing preventive measures advised by local governments in that order. The order is similar for the female sample as well.
To analyse implementation channels specific to women, in the first round female participants were asked the question: "when are you more likely to implement an advice", by listing three sources of information to choose from which included, (i) husband/ family member (ii) local government representative/panchayat officer and (iii) news on television/radio. In this regard, almost 48% respondents chose option one and 36% chose option two.
7.3 Misinformation
To understand levels of misinformation among participants and popular sources of such misinformation, we gave participants a list of items that they had to identify as true or false. In all rounds on an average, almost 71% men out of two pieces of wrong information and almost 93% women believe in at least one piece of misinformation (or myth) out of 4 pieces of wrong information. On an average men get almost 2 pieces of correct information right out of 2 and women get close to 3 out of 3 pieces of correct information.
The most common misconception among men is that goods from china can be dangerous and can spread the virus and the most common misconception among women is that garlic can help cure COVID-19. It is also noteworthy that on an average almost 16% men and 14% women believe that sounds and noises can kill the coronavirus. As much as it is important to note the information gaps that exist, it is also important to identify the channels of such myths. The top two sources reported for such misinformation among men and women are news and verbal conversations/friends and family, in that order. This also conveys how scattered pieces of information across different mediums, during a time that holds panic and confusion, could easily mislead people.
7.4 Stigma
When there is a pandemic, societal stigma is likely. To understand the aspect of stigma around the COVID-19 pandemic, in the last two rounds, primary male respondents were asked on how they think returning migrants from work places would be treated by people around them.
For this, out of the total who answered the questions on stigma, on an average almost 63% answered that these migrants would be assumed ill which was followed by 26% who responded that people around such migrants would inform the official authorities. This is represented in Figure 6.
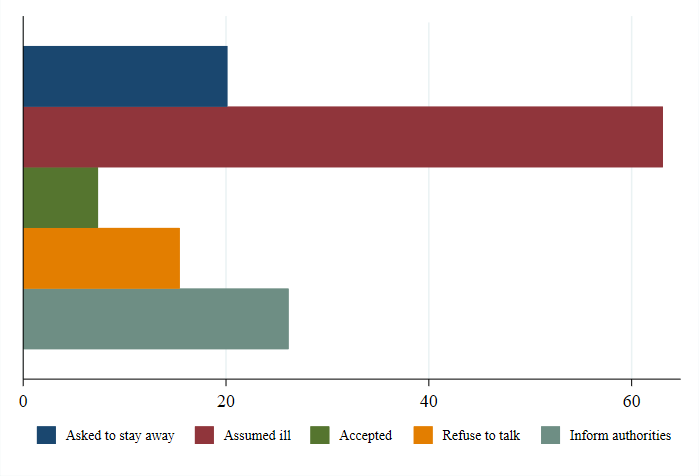
Figure 6: Treatment of Returning Migrants
Further, when the same population was asked how safe it was to talk to a corona cured person who has not shown symptoms for the last one week, out of the total responses a majority of 38% of the population answered that it is was safe with the second highest being almost 32% saying it was not safe.
8 Conclusion
The COVID-19 pandemic has had a debilitating effect on the physical, economic, and mental well being of migrant workers. However, there is a gradual improvement in these aspects, especially labour supply. In order to survive the post lockdown period, migrants will likely need continuous support: a considerable fraction remain unemployed or underemployed, have their food security threatened, live in temporary housing, and manage large households with many dependents. Many migrants also do not hold ration cards or do not have access to the PDS shops where they are currently located. In addition, widespread information dissemination and further management of supplies at the shops would help alleviate disruptions in the provisions of rations or other associated benefits (e.g., cash transfers). Besides measuring the impact of the pandemic on migrant labourers, it is also extremely important to apply a gender lens and address the doubling burden on women - both the paid sphere as well unpaid sphere. This report also raises some important considerations for future COVID-related policy. For instance, the positive effects of living in the city on employment chances is an important context when designing lockdowns and considering debates on funding migrants' transportation. Finally, this report also discusses how most migrants have been gaining awareness of various COVID-19 precautions. Elected representatives may be able to further increase awareness and adoption of COVID best practices as well as access to needed supplies such as masks.
9 Appendix
The Table 3 shows the number of respondents with timelines for each round during the entirety of the survey. This table helps one get an idea on the level of attrition across time.
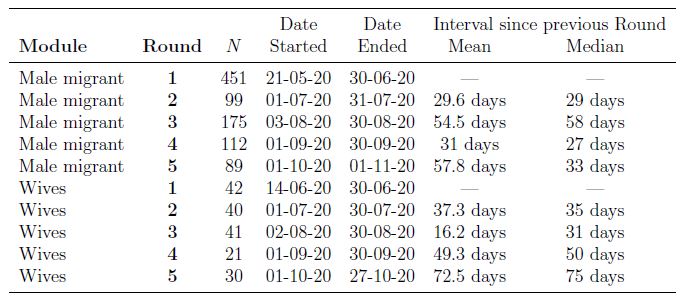
Table 3: Timing of Survey Administration
Figure 3: Left House
Figure 4: Safety Perceptions
Figure 5: Face Cover Usage
Table 2: Mental Health- Cantrill's
Further, in the male sample, with respect to which source of information the respondents are most likely to implement, the ranks have the same order as above, with almost 53% choosing speeches by government representatives and almost 51% choosing preventive measures advised by local governments in that order. The order is similar for the female sample as well.
To analyse implementation channels specific to women, in the first round female participants were asked the question: "when are you more likely to implement an advice", by listing three sources of information to choose from which included, (i) husband/ family member (ii) local government representative/panchayat officer and (iii) news on television/radio. In this regard, almost 48% respondents chose option one and 36% chose option two.
The most common misconception among men is that goods from china can be dangerous and can spread the virus and the most common misconception among women is that garlic can help cure COVID-19. It is also noteworthy that on an average almost 16% men and 14% women believe that sounds and noises can kill the coronavirus. As much as it is important to note the information gaps that exist, it is also important to identify the channels of such myths. The top two sources reported for such misinformation among men and women are news and verbal conversations/friends and family, in that order. This also conveys how scattered pieces of information across different mediums, during a time that holds panic and confusion, could easily mislead people.
For this, out of the total who answered the questions on stigma, on an average almost 63% answered that these migrants would be assumed ill which was followed by 26% who responded that people around such migrants would inform the official authorities. This is represented in Figure 6.
Figure 6: Treatment of Returning Migrants
Table 3: Timing of Survey Administration
∗University of California, Berkeley
†Behavioral Development Lab, Lead at Krea University
§University of Pennsylvania
Research Managers: Adrien Pawlik and Rakesh Pandey; Research Assistants: Vatsal Bajaj and Hemanth Bharatha Chakravarthy
Data collected by the Behavioral Development Lab: the BDL, housed under Leveraging Evidence for Access and Development (formerly IFMR LEAD) and Krea University and affiliated with the Abdul Latif Jameel Poverty Action Lab at South Asia (J-PAL SA), conducts numerous research projects at the intersection of behavioral and development economics to understand the causes and consequences of poverty. This particular project was funded by J-PAL Jobs and Opportunities Initiative.
[1] Refer Table 3
[2]In the male migrant module there are 35 individuals in round 1, 12 in round 2 and 9 individuals in round 3, 3 individuals in round 4 and 7 individuals in round 5 only partially completed the surveys. In the wive's module there are 3 individuals in round 1, 1 in round 2, 1 in round 3, 4 in round 4 and 1 individuals in round 5 only partially completed the surveys.
[3]Surveys were conducted roughly every 3 weeks. Hence, some participants were surveyed twice in a month or skipped a month and sample sizes are variable across months.
[4]Asked retrospectively
[5]Asked retrospectively
[6]Urban here included both city and towns
[7]Labor stands are meeting points of daily wage laborers to find work. These meeting points would have different kinds of workers and recruiters gather to organise a day's work. These are places where daily wage workers try to find potential employers and employers try to find potential workers.
[8]This question was initially asked as no: of days worked in the last two weeks and was later changed to last one week. Therefore, for the purpose of analysis, the initial period for 2 weeks was converted to a week.
[9]Care work is defined as caring for the elderly, children, or people who need to be attended to at home.
[10]By either reducing the number of meals they eat or reducing the quantity of intake per meal.
[11]Cantril's Scale is a well being measurement ladder, numbered from 0 to 10, 0 indicating the worst possible life and 10 indicating the best possible life. This is a two part question, where participants indicate a well being level before the pandemic and then after the pandemic
[12]The Patient Health Questionnaire has 4 questions covering anxiety, unable to stop worrying, reduced pleasure/enjoyment in life and lastly hopelessness. The scale measures how often people feel these emotions by marking on a range from 1 (Not at all) to 4 (Nearly every day)
Data and Report
| No | Title | Download |
|---|---|---|
| 1 | Impact of the Lockdown on the Indian Village Economy Report | |
| 3 | Raw-Data | Resource Page |